Hitec Instruments designs each solution around the metering boundaries required by the project.
Depending on the site’s electrical architecture and operating needs, these can cover the mains and standby supplies, main LV distribution, UPS systems, cooling and final IT circuits.
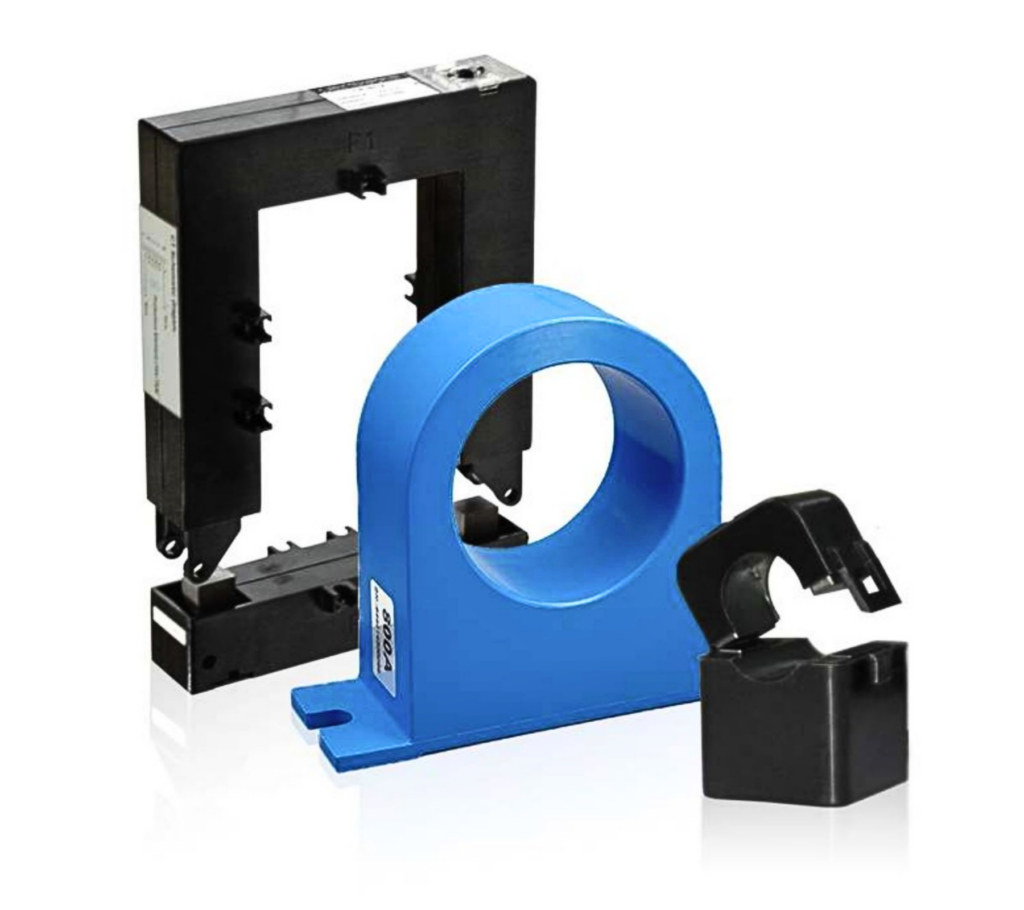
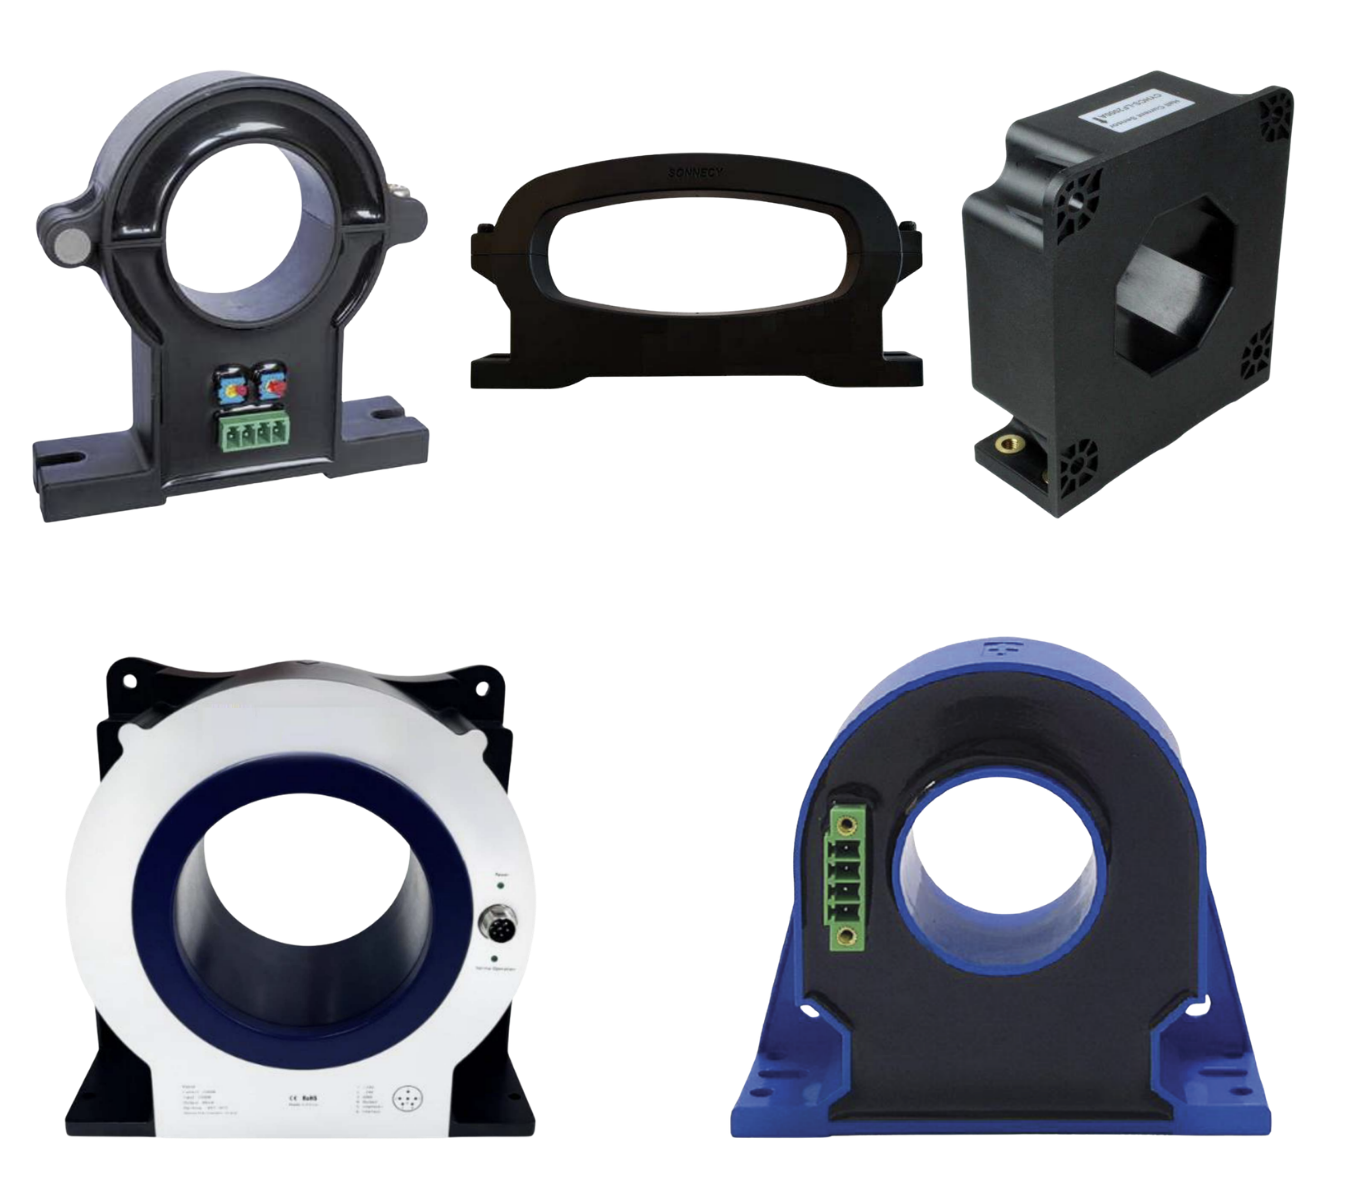
The appropriate SATEC meter is specified for each boundary, with CTs or HACS current sensors selected to suit the circuit. The agreed data is then passed to the Energy Management Software selected for the project.
Each reading remains tied to the equipment and part of the electrical system it represents.
This gives engineers the data they need to investigate power quality events, review maximum demand, assess loading and available headroom, plan capacity, support PUE calculations and, where required, allocate energy to customers.
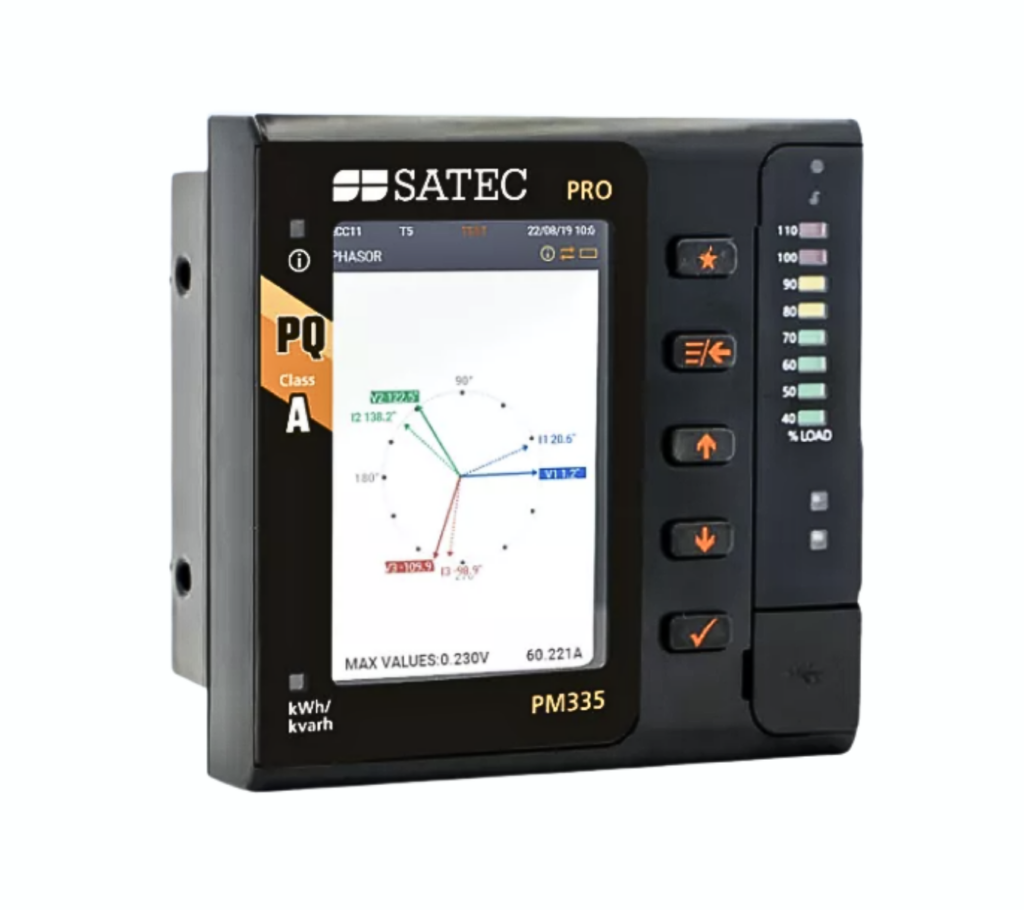
One PM335-PQ-A monitors the utility supply and another monitors the standby generator supply. This keeps the measurements from the two sources separate. The meters provide Class A power quality analysis to IEC 61000-4-30, Edition 3.1. They measure electrical parameters, energy and demand, record events and waveforms, and analyse harmonics.
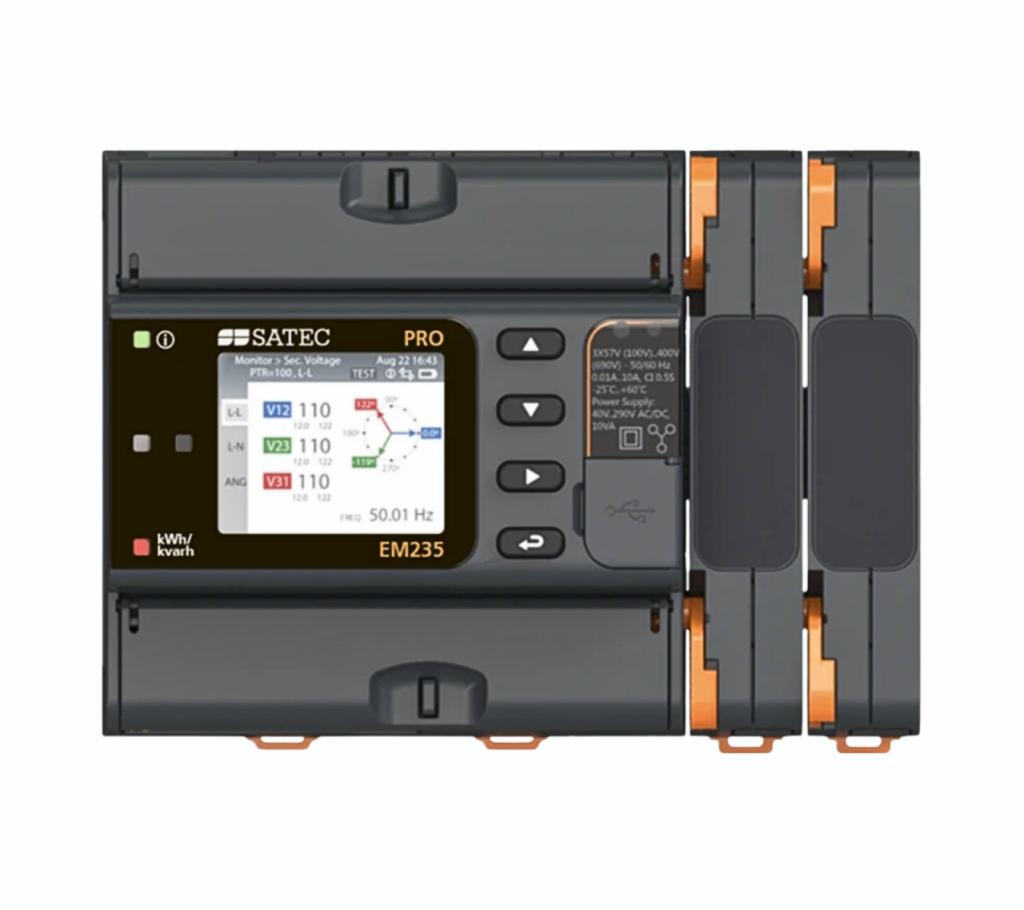
PM335 meters are used at the UPS input and output. Comparing their readings shows the loading, energy and demand on each side of the UPS and supports assessment of UPS losses and efficiency. An EM235 with three HACS current sensors monitors the three-phase HVAC circuit.
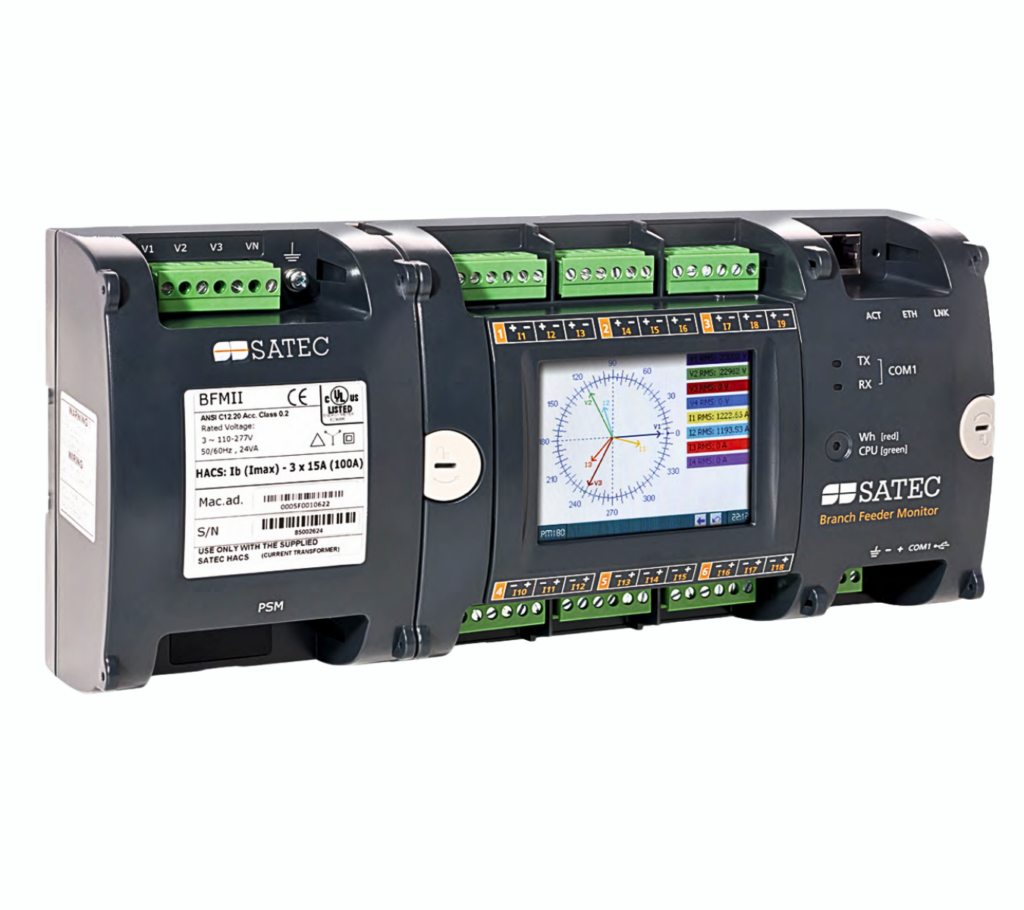
BFM-II units with HACS monitor the final circuits supplying the server racks. Depending on the configuration, a single BFM-II can monitor up to 18 three-phase circuits or 54 single-phase circuits, or a combination of the two. It provides separate load, demand and energy data for each circuit, allowing engineers to assess rack-level loading and available capacity. In colocation data centres, the same measurements support customer energy allocation and billing at circuit, rack or tenant level.
Data from the incoming supplies, UPS, HVAC and final IT circuits is collected in the Energy Management Software. The agreed data can be organised by source, power path, room, customer and rack, giving engineers one place to review energy use, demand, loading and the data used for power quality investigation, PUE and capacity planning. The software platform, data, views and reports are selected for each project. The blue dashed lines show this data flow.
What engineers can do with the data
When relevant records use a common time reference, engineers can compare what was recorded at the source, UPS and downstream boundaries. This helps narrow the investigation to the affected section and shows how the rest of the system responded.
Measurements can be organised by site, transformer, UPS, switchboard, feeder, room, customer and rack. Comparing actual loading with the relevant design limit shows where spare capacity remains and where demand is approaching the available limit.
Separate source measurements allow utility and generator performance to be reviewed independently. Where the required signals are included, electrical data can also be viewed alongside ATS status, generator runtime and fuel information, or UPS bypass and transfer events.
Depending on the selected software and project scope, information can be arranged by source, supply path, room, customer, zone and rack. The agreed views and reports can support power quality investigation, capacity review, PUE calculations, customer energy allocation and comparison of contracted capacity with actual demand.
Hitec Instruments developed RTR to collect the required readings from every SATEC meter in this architecture and deliver them to the site’s software environment.
RTR polls the meters directly over Modbus and sends the data to the agreed SCADA system, database, API or cloud platform. The Energy Management Software can then use this data for analysis, visualisation and reporting.
SATEC meters across the electrical system → RTR → site software and data systems
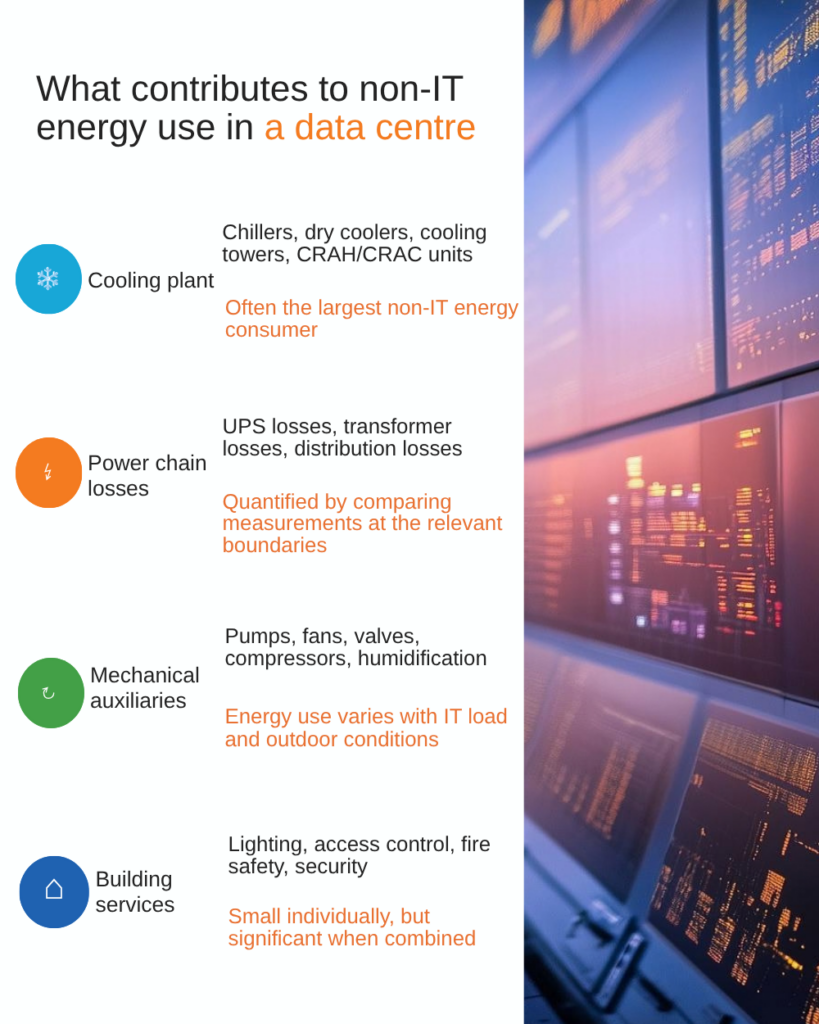
PUE compares the total energy consumed by the data centre with the energy consumed by the IT equipment over the same reporting period.
PUE = Total data centre energy ÷ IT equipment energy
The total data centre energy includes electricity from every source supplying the data centre within the agreed boundary during the reporting period. Electricity generated on site is included when it supplies the data centre. The IT equipment energy must cover the same period and the agreed IT measurement boundary.
Readings from meters positioned one after another on the same power path are not added together, as this would count the same energy more than once. Measurements at the UPS input and output allow UPS losses to be assessed, while the HVAC and final IT measurements distinguish cooling demand from IT equipment energy.
Project information needed before solution design
Facility profile and electrical information
Measurement and reporting requirements
Existing data systems
Metering and software design
Project outputs
Project outcome
The result is a metering and Energy Management Software architecture matched to the site’s electrical topology, operating model and reporting requirements.
Send us your current single-line diagram and a brief outline of what you need to measure, monitor and report. Hitec Instruments will review the electrical arrangement and define the metering approach for your site.
We use cookies to improve site performance, analyse usage and support our services.
You can accept all cookies, reject non-essential ones, or adjust your preferences.